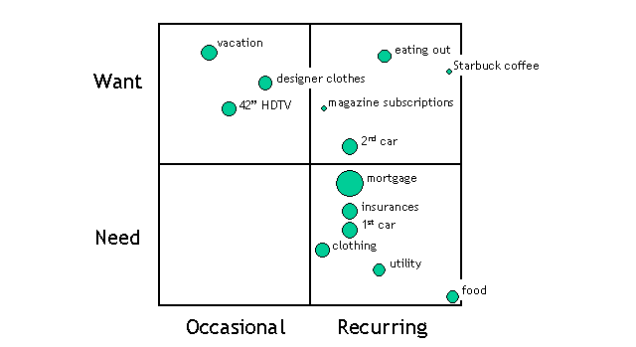
Moolanomy writer Pinyo Bhulipongsanon calls it a "scattergram"—a graph that shows two characteristics. In this case, the characteristics are: frequency and necessity.
When you physically plot your expenses on a scattergram (or simply visualizing it), the process help you understand each of them better and give you a place to start formulating your plan."
credit: LifeHacker


 RSS Feed